


Fact Sheet: Total Work Days Lost
Fact Sheet: Trends in Healthcare lost time, injury recovery, workplace premiums and total work days lost
There are a number of statistics and trends that help us better understand how the pandemic has impacted people working in healthcare, employers, and the overall system. We looked at the trends from January 1, 2018, to December 31, 2022. We also compared healthcare to other sectors and found when it comes to lost time claims – up 85%, total work days lost – up 85%, injury recovery rates – up 96 to 130% and assessable payroll – up 190%, healthcare is far above the provincial average.
This information is available through WorkSafeBC’s public tableau. The data we’ve pulled comes from WorkSafeBC’s subsector category ‘healthcare and social services’ and is not healthcare only data.
Lost time claims
Lost time (or time-loss) is the number of claims where the injuries occurred in a given year and were accepted for short-term disability, long term disability, or survivor benefits in that year or in the first three months of the following year.
From January 1, 2018, to December 31, 2022, the number of lost time claims in the healthcare and social services sector increased from 8,993 in to 16, 596. That’s an 85% increase in number of claims.
In comparison, the number of lost time claims in all industries increased by 4% over that same time period.
Total work days lost
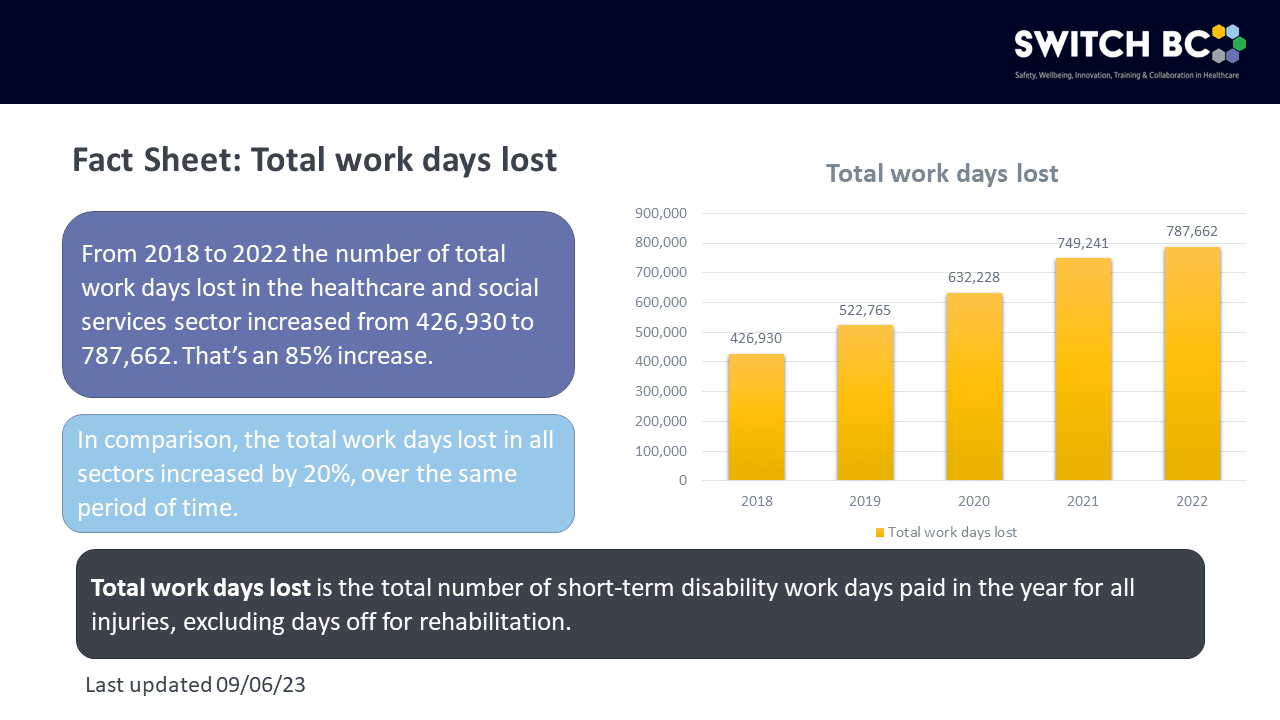
Total work days lost is the total number of short-term disability work days paid in the year for all injuries, excluding days off for rehabilitation.
From January 1, 2018, to December 31, 2022, the number of total work days lost in the healthcare and social services sector increased from 426,930 to 787,662. That’s an 85% increase.
In comparison, the total work days lost in all sectors increased by 20%, over the same period of time.
Injury Recovery
From January 1, 2018, to December 31, 2022, workers in healthcare and social services who returned to work following an injury within four weeks increased by 120%, within 26 weeks increased by 96%, and after more than 26 weeks increased by 130%.
In comparison, workers in all sectors who returned to work following an injury in four weeks increased by 25%, within 26 weeks by 14%, and after 26 weeks by 60%.
Insurance Trends and Statistics
From January 1, 2018, to December 31, 2022, the amount healthcare and social services sector employers paid WorkSafeBC increased by 190% (up more than $300 million) from $177 million to $397 million. During the same period, the healthcare payroll (the number of additional employees hired, or wages adjusted) increased by 50%.
In comparison, the assessment for all B.C. employers increased by 29% and the total assessable payroll increased by 31%, during the same period.
Links